Explainable AI#
Neural network predictions are a black box — until you can interact with them directly. LIT's Playground lets you run live inference against any vaulted model, modify inputs to explore counterfactual scenarios, and analyze which features drove each prediction.
Playground#
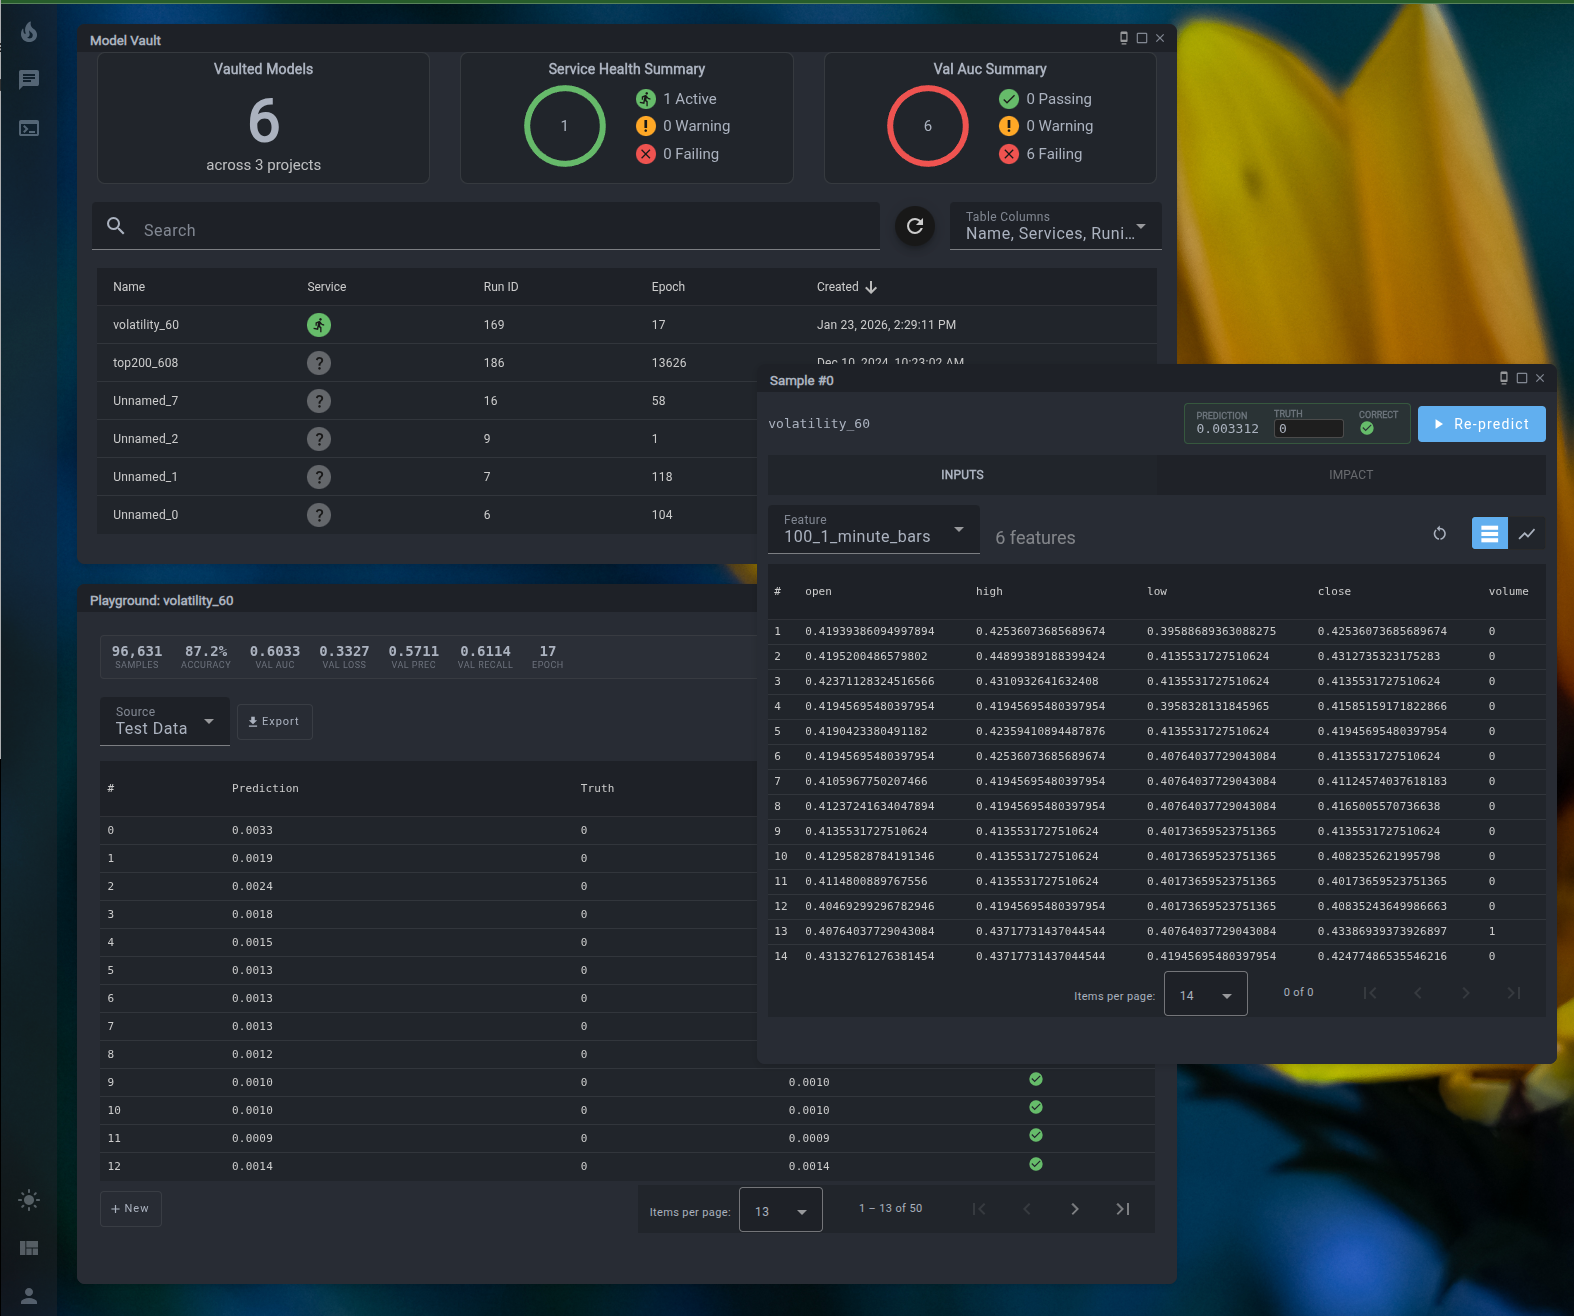
Open any vaulted model in the Playground to run inference on real test samples — no code required. Select a sample, click Predict, and see the model's output alongside the known ground truth.
- Edit any feature value and re-run prediction instantly to explore "what if" scenarios
- Compare prediction against ground truth with a pass/fail indicator
- Browse inputs in table or time series chart view
- Reset to original sample values at any time
Feature Impact#
The Impact tab runs a causal feature importance analysis, showing which inputs drove the prediction and by how much. Each feature is scored by magnitude and direction — positive or negative contribution to the output.
Use this to:
- Identify which inputs matter most to model decisions
- Detect features with outsized or unexpected influence
- Validate that the model is reasoning about the right signals
- Explain a specific prediction to a stakeholder or auditor
Implementation Overview: Counterfactual Analysis#
This implementation provides visualization and interaction with the predictions of an AI model over time. By selecting a data point on the model prediction graph, detailed information about the corresponding prediction can be viewed.
Key Functionalities:#
-
Detailed Prediction Insights:
- Users can click on any data point in the graph to view comprehensive details about the selected prediction.
- These details include the prediction's numerical values, input parameters, and any related metadata.
-
Dual Input Data Representation:
- The input data driving the prediction is displayed in tabular format for numerical clarity.
- A complementary graphical visualization is provided to highlight trends, relationships, and anomalies.
-
Scenario Exploration:
- Users can modify input data directly through the interface to simulate "what-if" scenarios.
- These modifications enable exploration of alternative outcomes and allow users to test the model's sensitivity to changes in inputs.
-
Real-Time Feedback:
- As input data is adjusted, the model dynamically updates its predictions.
- This real-time response ensures instantaneous observation of the impact on predictions, enhancing the exploratory experience.
-
Fostering Transparency and Trust:
- By enabling direct interaction with the model and its inputs, the feature encourages a hands-on approach to understanding AI behavior.
- This transparency promotes trust in AI-driven decisions by allowing users to validate predictions and assess the model's reasoning process.
Use Cases and Applications#
- AI Model Auditing: Quickly identify how specific inputs influence predictions to ensure fairness, accuracy, and reliability.
- Decision Support: Use real-time scenario analysis to support data-driven decision-making in dynamic environments.
- Education and Training: Help teams or stakeholders better understand AI model behavior and its implications in practical applications.